

Buses Beat Cars: Emissions, Deaths, and Statistics
Breaking down the benefits of buses by the numbers


In my last post on buses as an American climate solution, it felt like there were too many aspects to introduce to get into the weeds on specific statistics. This post will aim to fill that gap. I can’t make the case that (electric) buses are the right path forward if I don’t have some empirical evidence to back me up, so let’s dive into what the evidence says about the potential transit mascot of 2023.
Emissions
The first point of comparison we should make is big-picture, just between the different modes of transit. The CBO has our data.

The above graph compares carbon emissions by mode of transit based on rate per passenger-mile. A passenger-mile is the movement of one passenger over one mile. A personal car with only the driver inside driving one mile would equate to one passenger-mile. A bus with ten passengers driving the same mile would equate to ten passenger-miles. So, even though gas/diesel buses get lower MPG than ICE cars in an absolute sense, if they carry more people, they produce emissions at a lower rate per person moved.
Looking back to the graph, cars are the worst emitters followed by buses, planes, and trains, respectively. But, the vast majority of buses in America are not electric. They are mostly diesel and methane gas, with just a few hybrids in the mix. As the graph shows, this bus mix is still bit cleaner than cars, and we would make a dent in emissions if a lot of cars were replaced with the popular buses of today.
But we would make a much, much greater dent if we replaced these cars with electric buses, the much more efficient cousins of the diesel and methane buses. Looking below at the map from the Union of Concerned Scientists (UCS), we can see how efficient diesel buses would have to be to match electric buses on life cycle global warming emissions.

Here in California, a diesel bus would have to get 21.2 MPG to have as few emissions as an electric bus powered by our grid (the different rates reflect how an electric bus’s emissions vary based on how clean the grid which it charges from is). Throughout the country, electric buses are nearly three times as clean as fossil buses.
And we can see the breakdown in actual emissions (in grams of carbon dioxide per mile) below.

Another plus is that electric buses produce no tailpipe emissions, which means they don’t harm the air quality where they operate in cities and towns. Instead of an idling diesel bus producing harmful particulate matter which people then immediately breathe in, we could have an electric bus which produces no such emissions and wastes less energy at its frequent stops.
To relate the bus comparison back to cars, we can calculate a rough estimate for the electric bus emission rate per passenger-mile. Using the CBO’s numbers for emissions per passenger-mile for buses and the UCS’s numbers for emissions per mile, we get an average number of passengers as roughly 14 people per bus (which lines up approximately with estimates from the Department of Transportation).
Using this average, we can calculate the the average CO2 emissions from an electric bus in the US to be about 77 grams per passenger-mile (g/pmi). This is considerably lower than the comparable emissions rate for (new) cars: around 230 g/pmi (calculated either from the CBO data or Energy Dept. estimates paired with average car occupancy being “1.5 persons” from a UMich study).
So, 77 grams for electric buses vs 230 grams for cars. Electric buses are roughly four times as clean as an average, new car in the US. The rates are even more disparate for old cars with lower MPG rates, and this gap will likely continue to grow as the US grid charging these buses gets cleaner.
Another reason the gap will grow is because of the huge increase in larger personal vehicles with lower MPGs that has been happening in recent years.

“Accidents”
The emissions benefits are clear. But there are other pros to reducing the number of cars on the road. I touched on them very briefly in the last article, noting how we could have cleaner, quieter cities that are more pleasant to live in if urban design was not so car-centric. I could write a dozen articles about all these benefits, but, for now, I just want to highlight one of the most extreme costs that cartopia burdens us with: the car “accident.”
“Accident” is a deceptive name since, although most drivers do not intend to cause crashes, the vast majority of car crashes can be traced back to policy decisions. The car-dependent design of our (sub)urban environments is directly responsible for how many of these “accidents” we experience. Cars are prioritized. People are not. This equation results in lots of car death.

The dangers of cars loom over all Americans, but they are especially crushing to our youth. In recent history, motor vehicle crashes have been far and away the leading cause of death for Americans under 19 years old, completely dwarfing all other death-bringers during the turn of the century.

Only recently have vehicles been surpassed by firearms as the leading cause of death in minors, partially due to falling crash deaths but also because of a rapid increase in firearm deaths. Drug overdose has also increased in recent years, but it is still significantly lower than car crashes and gun deaths.
The above graph is from a study in the New England Journal of Medicine. A previous iteration of the study from 2016 compared the rates from the US with other countries. The numbers, perhaps unsurprising given our established cartopia, are the following:
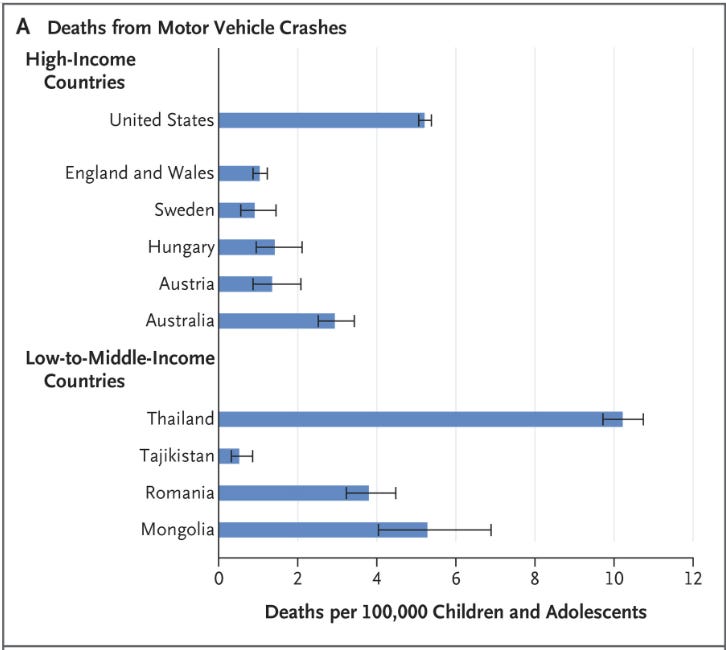
While Thailand squarely beats us out, and Mongolia stands on par with us, the US stands alone among high-income countries for our high rate of child deaths due to vehicles. And this is in comparison with countries that have their own problems with car dependence, like England.
Though, even compared to other possibly car-dependent countries, we are number one. And, to be fair to England/the UK, this 1979 ad exists for a reason:

We need to serve our kids better, from statistically real threats like cars and guns. I want to be able to let my future kid play outside without worrying if a car is going to kill them. Obviously, there will always be a chance. But the data shows that the current “chance” is way too high and, worst (or best?) of all, it doesn’t need to be! Other countries compared - Sweden, Hungary, and Austria - all still have cars! People still drive, but they have a less dangerous system set up.
And it’s less dangerous not just for kids, but for everyone. All Americans are plagued by the danger of our system:

Another unsurprising result given the previous country comparison, but the US also reigns supreme when looking at crash death rates for all ages. When looking at our economic and development peers, the US is over twice as dangerous as the average for vehicle deaths. Compared to some of the best-in-class, the US is over five times as dangerous.
There are a ton of ways to limit these death rates. Cars can be made safer, ambiguous “stroads” can be removed, pedestrian considerations can be made more concrete, maybe even autonomous driving will eventually really work and reduce human error! While we can hope for future technology to help, we shouldn’t wait. Choosing to wait is choosing to keep killing tens of thousands of Americans every year.

We need to take action now to reduce deaths, and our focal solution can do so while also reducing emissions, thereby reducing even more potential climate deaths.
We have seen the danger of cars in the data, and the data also says buses are safer.
Just looking to our north, we can see the safety of buses on display in Canada. This urban health study compared bus and car injury rates “along major urban arterials” in Toronto. It found that cars caused greater injury rates for everyone.
For the same amount of passenger-distance, cars produced 3.7 times as many injuries for vehicle occupants as compared to buses. They produced 4.1 times as many injuries for pedestrians, and 5.3 times as many for cyclists. I know we like our jokes about how cyclists are annoying, but that doesn’t warrant quintupling their chance of injury, not to mention quadrupling the rate for pedestrians A.K.A. people just walking around. And if empathy is completely dead, drivers within their cars are still at over three times the risk in their own car than they would be in a bus. However, that’s all just in terms of injuries. The picture becomes even more grave if we shift focus to deaths.
Below is a comparison of US deaths per passenger-mile in different modes of transit.

These are not absolute death numbers, something which could maybe be explained away by our much higher preference for cars. These are the rates of death for the same person-distance covered. In 2020, every time buses caused 1 death, cars caused 25.
If there were any other case, whether in medicine, food, or public policy, where an alternative choice could decrease one’s risk of death 25-fold, there would be no conversation. You choose the thing that’s 25 times less likely to kill you. We, as a society, choose the thing that cuts deaths by 2500%.
But we don’t.
There is always a philosophical conversation to be had about what we value. Would we trade all of life’s pleasures to live in a sterilized environment that we know won’t harm us? Most would answer no (even if we seem to occasionally side with that motivation unintentionally). And I think such an answer is right. Living a good life is not synonymous with living the absolute safest life possible. But that is no reason against taking reasonable precautions. Just because safety is not the sole variable in decision making doesn’t mean it is not a prominent one.
We need not obliterate every car in existence, banning them all from ever touching a public road again. But no one is suggesting we do that. Here, I am simply suggesting that we drive less and (make it possible to) use other forms of transit more, buses in the short-term, rail in the long-term, and walking and bicycling in the every-term.
In 2020, cars drove 4,303,000 million passenger-miles. Buses drove just 306,000 million. Is it right that the 25x-more-likely-to-kill-us option is an order of magnitude more prevalent?